Fig. 1
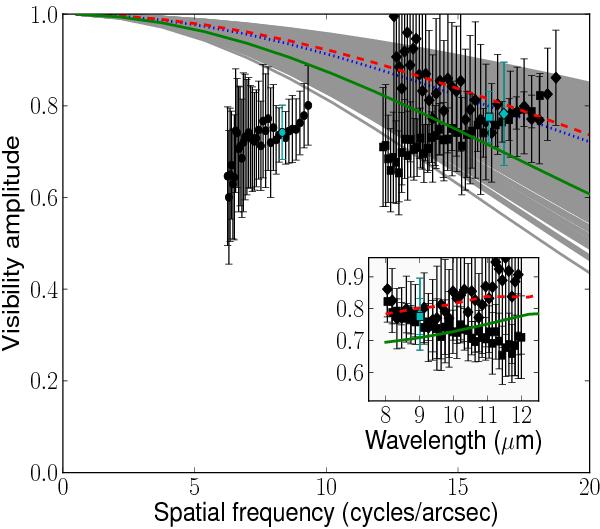
Three baselines of MIDI data overplotted (at a single continuum wavelength, indicated in cyan) with all double power-law MCMax models computed in Sect. 5. The dotted blue line, “Best 1” in Table 1, is the best single power-law MCMax model in terms of fitting the near-IR visibilities (see Figs. 4 and 5). The dashed red line corresponds to the best-fitting double power-law model with the metallic Fe opacity source (“Best 2” in Table 1). The full green line shows the best-fitting double power-law model when metallic Fe is replaced by amorphous C (“Best alt.” in Table 1). See Sects. 4.2, 5.1, and 6 for a discussion of the models. The inset shows the data at the 30 m baselines as a function of wavelength, with the same double power-law models overplotted as in the main panel.
Current usage metrics show cumulative count of Article Views (full-text article views including HTML views, PDF and ePub downloads, according to the available data) and Abstracts Views on Vision4Press platform.
Data correspond to usage on the plateform after 2015. The current usage metrics is available 48-96 hours after online publication and is updated daily on week days.
Initial download of the metrics may take a while.