Fig. 7
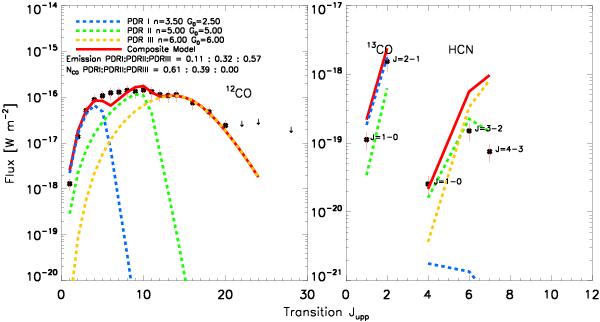
Left panel: a χ2 minimized fit of the CO ladder of Arp 299 A from J = 1−0 through 24–23. The fit was constrained to three PDR models, displayed in blue, green, and yellow. The black points are the observed CO fluxes and the red line is the total model fit. Right panel: the same models as the left panel, but the fits for the 13CO and HCN fluxes. The HCN model lies far above the observed J = 3−2 and 4–3 HCN fluxes.
Current usage metrics show cumulative count of Article Views (full-text article views including HTML views, PDF and ePub downloads, according to the available data) and Abstracts Views on Vision4Press platform.
Data correspond to usage on the plateform after 2015. The current usage metrics is available 48-96 hours after online publication and is updated daily on week days.
Initial download of the metrics may take a while.