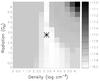
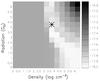
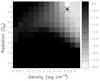
Fig. 5

Degeneracy plots for Arp 299 B+C. Each plot represents the full grid of models for each phase in Fig. 4, PDR I (left), PDR II (center), PDR III (right). The asterisk represents the model with the lowest χ2, which are also plotted in Fig. 4. The gray scale of each small square indicates the associated log(χ2) value for that particular model, white being the best fits and black being the worst. The χ2 value is defined in Eq. (3) and shown in log gray scale.
Current usage metrics show cumulative count of Article Views (full-text article views including HTML views, PDF and ePub downloads, according to the available data) and Abstracts Views on Vision4Press platform.
Data correspond to usage on the plateform after 2015. The current usage metrics is available 48-96 hours after online publication and is updated daily on week days.
Initial download of the metrics may take a while.