Fig. 4
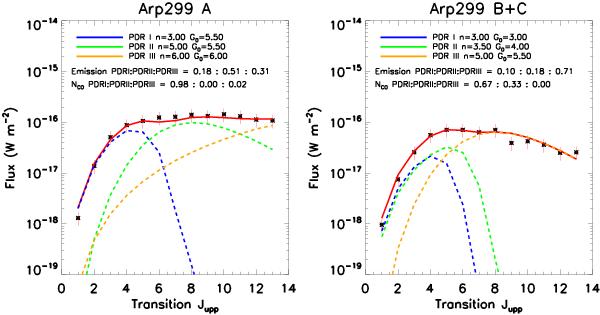
Best fit (χ2 minimized) PDR models simulating the 12CO emission for Arp 299 A (left) and B+C (right) using three ISM phases. The red line is the sum of the three phase models, the black asterisks are the data points with error bars, and the blue, green, and orange lines represent the independent PDR models for each phases. The model density, temperature and column density are shown in the legend along with the relative contribution of each phase in terms of emission and column density.
Current usage metrics show cumulative count of Article Views (full-text article views including HTML views, PDF and ePub downloads, according to the available data) and Abstracts Views on Vision4Press platform.
Data correspond to usage on the plateform after 2015. The current usage metrics is available 48-96 hours after online publication and is updated daily on week days.
Initial download of the metrics may take a while.