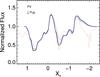
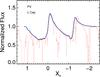
Fig. 6
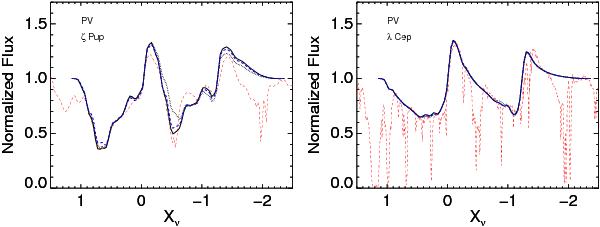
Observed and modeled PV spectra of ζ Pup, observations from Copernicus, and λ Cep, observations from FUSE. Black solid and blue dashed lines are vmSEI model fits from the first and second solution branches, respectively (see text), the dotted black lines are fits from a smooth-wind model, and red dashed lines are the observations.
Current usage metrics show cumulative count of Article Views (full-text article views including HTML views, PDF and ePub downloads, according to the available data) and Abstracts Views on Vision4Press platform.
Data correspond to usage on the plateform after 2015. The current usage metrics is available 48-96 hours after online publication and is updated daily on week days.
Initial download of the metrics may take a while.