Fig. 1
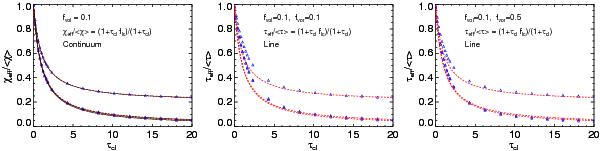
Ratios of effective to mean opacity/optical depth for continuum absorption (left) and line absorption (middle, right), as functions of clump optical depth and for the parameters given in the panels and inter-clump density parameters fic = 0, 0.01, and 0.2 (where the fic = 0.2 curve is the upper one in each panel). Note that the clump velocity span is δν = δνsm in the middle panel and δν = 5δνsm in the right one. Red dashed lines show the effective opacity/optical depth laws indicated in the figure, blue triangles show results from the 3D-box experiments described in the text, and the black solid lines in the left panel show the analytic expression given in Appendix A.
Current usage metrics show cumulative count of Article Views (full-text article views including HTML views, PDF and ePub downloads, according to the available data) and Abstracts Views on Vision4Press platform.
Data correspond to usage on the plateform after 2015. The current usage metrics is available 48-96 hours after online publication and is updated daily on week days.
Initial download of the metrics may take a while.