Free Access
Fig. 6
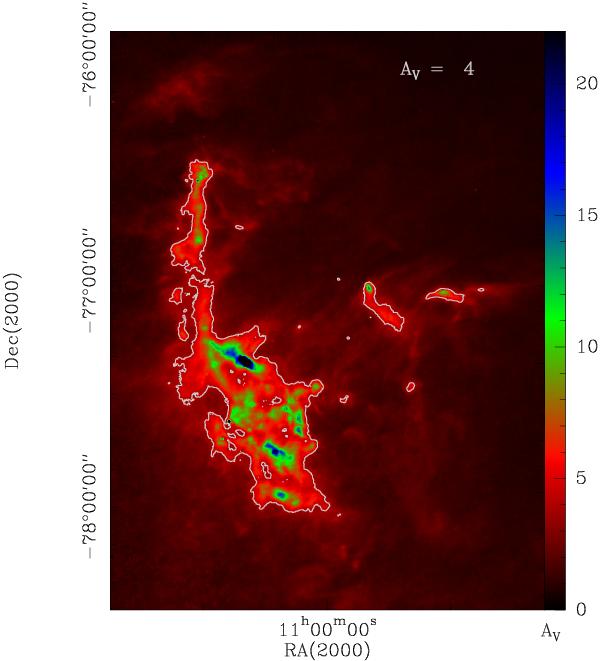
Column density map of Cha I in which the colour scale is chosen to represent the characteristic AV levels (4, 10, and ~20 mag) seen in the PDF. The AV = 4 mag level is indicated as a grey contour, while the other two levels become obvious as a change in colour.
Current usage metrics show cumulative count of Article Views (full-text article views including HTML views, PDF and ePub downloads, according to the available data) and Abstracts Views on Vision4Press platform.
Data correspond to usage on the plateform after 2015. The current usage metrics is available 48-96 hours after online publication and is updated daily on week days.
Initial download of the metrics may take a while.