Free Access
Fig. 5
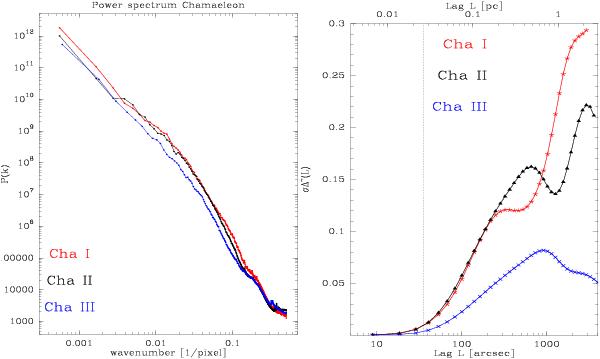
Left: power spectra of the column density maps of the Chamaeleon clouds, which were determined from the Herschel images reprojected to a common 6′′/pixel grid (see Sect. 3.1). Right: the Δ-variance spectra of the same column density maps. The dotted vertical line indicates the resolution limit of 36′′.
This figure is made of several images, please see below:
Current usage metrics show cumulative count of Article Views (full-text article views including HTML views, PDF and ePub downloads, according to the available data) and Abstracts Views on Vision4Press platform.
Data correspond to usage on the plateform after 2015. The current usage metrics is available 48-96 hours after online publication and is updated daily on week days.
Initial download of the metrics may take a while.