Fig. 4
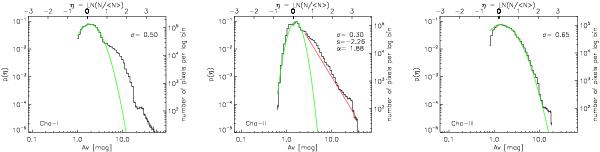
Probability distribution functions of the column density for the Cha I, II, and III cloud regions. The PDFs were obtained from the column density maps (Fig. 2) at an angular resolution of 36′′. The left y-axis indicates the normalised probability and the right y-axis the number of pixels per log bin. The green line indicates the fitted PDF and the red line (in Cha II) the power-law fit to the high-density tail. The width of the PDF (σ), the fitted slope s, and the corresponding exponent α of a spherical density distribution are given in each panel.
Current usage metrics show cumulative count of Article Views (full-text article views including HTML views, PDF and ePub downloads, according to the available data) and Abstracts Views on Vision4Press platform.
Data correspond to usage on the plateform after 2015. The current usage metrics is available 48-96 hours after online publication and is updated daily on week days.
Initial download of the metrics may take a while.