Free Access
Fig. 3
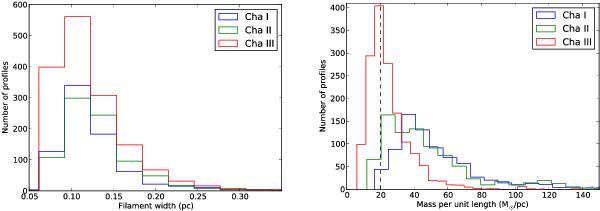
Distribution of the width (left) and mass per unit length (right) for individual profiles, as derived for Cha I (blue), Cha II (green), and Cha III (red). In the mass-per-unit-length histogram, the dashed line shows the thermal critical mass per unit length for a gas temperature of ~12 K.
This figure is made of several images, please see below:
Current usage metrics show cumulative count of Article Views (full-text article views including HTML views, PDF and ePub downloads, according to the available data) and Abstracts Views on Vision4Press platform.
Data correspond to usage on the plateform after 2015. The current usage metrics is available 48-96 hours after online publication and is updated daily on week days.
Initial download of the metrics may take a while.