Fig. 9
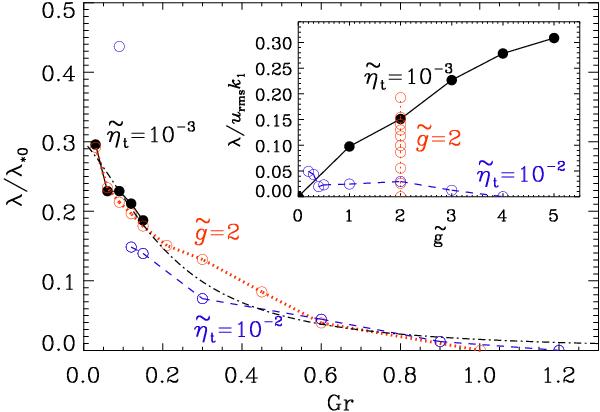
Normalized growth rate of NEMPI versus stratification parameter Gr that varies with changing gravity, g, for Co = 0 with constant  (
( black filled symbols and
  blue open symbols), or with changing ηt = νt for constant
  (red open symbols). The dash-dotted line shows the approximate fit given by Eq. (40). The inset shows the growth rate normalized by the turnover time as a function of
  .
.
Current usage metrics show cumulative count of Article Views (full-text article views including HTML views, PDF and ePub downloads, according to the available data) and Abstracts Views on Vision4Press platform.
Data correspond to usage on the plateform after 2015. The current usage metrics is available 48-96 hours after online publication and is updated daily on week days.
Initial download of the metrics may take a while.