Fig. 5
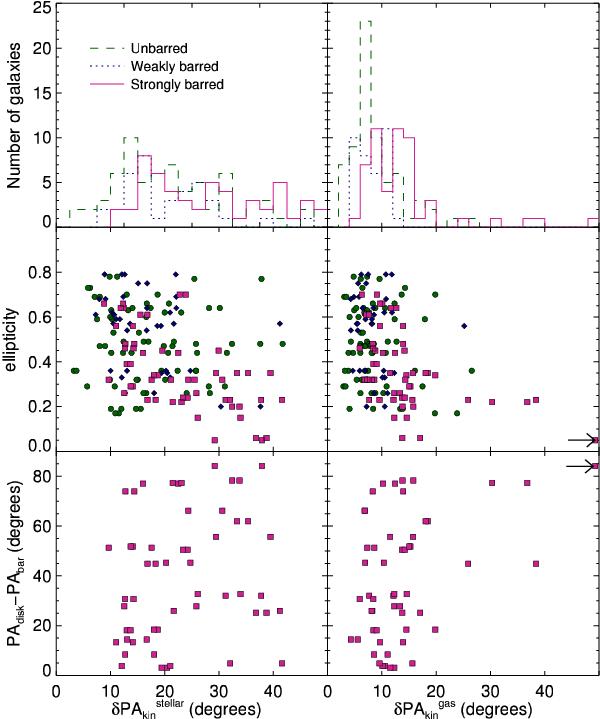
Top: histograms of the kinematic PA deviations from a straight line in the velocity maps measured via δPA (left) and δPA
 (right) separated by different bar strengths. Dashed lines represent the unbarred galaxies, dotted lines correspond to the weakly barred galaxies and solid lines shows the distribution of strong barred galaxies. Middle: apparent flattening of the galaxies via the ellipticity, as in previous figures, the green filled circles represent the unbarred galaxies, blue diamonds correspond to weakly barred galaxies, and violet squares represent the barred galaxies. Bottom: difference between the PA of the disc (PAdisc) and the PA of the bar (PAbar) for strongly-barred galaxies alone. Arrows in middle and bottom gas panels indicate the galaxy NGC 171 (δPA
 ).
).
Current usage metrics show cumulative count of Article Views (full-text article views including HTML views, PDF and ePub downloads, according to the available data) and Abstracts Views on Vision4Press platform.
Data correspond to usage on the plateform after 2015. The current usage metrics is available 48-96 hours after online publication and is updated daily on week days.
Initial download of the metrics may take a while.