Fig. 2
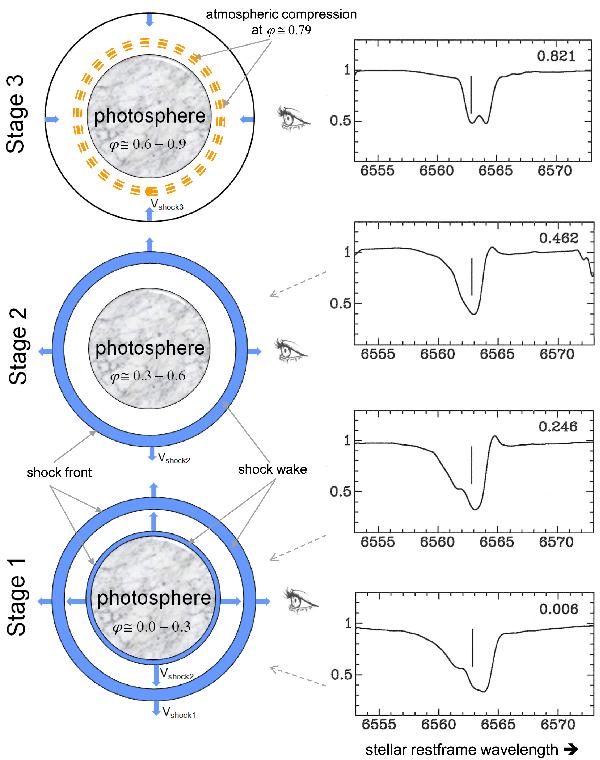
Hypothetical scheme of evolution of the Hα line profile when the main shock wave propagates in the envelope of the long-period Cepheid X Cygni. Stage1 begins around the luminosity maximum i.e. when the main shock front induced by the current pulsation cycle (shock 2) is emerging from the photosphere. In addition, from phase 0.062, the main shock front of the previous cycle becomes visible because of the appearance of a P Cygni profile, which means that the shock front (shock 1) is well detached from the photosphere. At that time, two shock waves are simultaneously visible. During the second stage (pulsation phases between 0.3 and 0.6), only the main shock of the current pulsation cycle is visible (shock 2). In this interval of phases, it is well detached from the photosphere and consequently, the Hα line is now a P Cygni profile. Finally, the third and last stage (pulsation phases between 0.6 and 0.9) shows the infalling shock (shock 3) induced by atmospheric layers falling by gravity on the photosphere. The expanding shell (blue or gray area), just behind the shock front, is actually the radiative wake of the shock in which is formed the Hαemission line. Line profiles are clean profiles derived from observations of Fig. 1.
Current usage metrics show cumulative count of Article Views (full-text article views including HTML views, PDF and ePub downloads, according to the available data) and Abstracts Views on Vision4Press platform.
Data correspond to usage on the plateform after 2015. The current usage metrics is available 48-96 hours after online publication and is updated daily on week days.
Initial download of the metrics may take a while.