Fig. 1
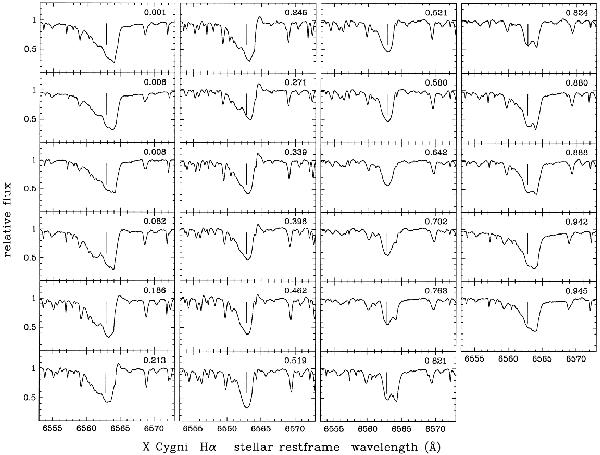
Observed profiles of the Hα line for X Cygni between July 1989 and September 1992 at the 1.52 m telescope of the Observatoire de Haute-Provence. The pulsation phase ϕ is denoted in the upper corner of each spectrum where the wavelength is given in Å in the stellar rest frame and the small vertical lines give the position of the laboratory wavelength of Hα. The spectrograph AURELIE at a resolving power R = 60 000 was used. This figure was produced by M.G. Breitfellner during his thesis work (Breitfellner 1993).
Current usage metrics show cumulative count of Article Views (full-text article views including HTML views, PDF and ePub downloads, according to the available data) and Abstracts Views on Vision4Press platform.
Data correspond to usage on the plateform after 2015. The current usage metrics is available 48-96 hours after online publication and is updated daily on week days.
Initial download of the metrics may take a while.