Fig. A.5
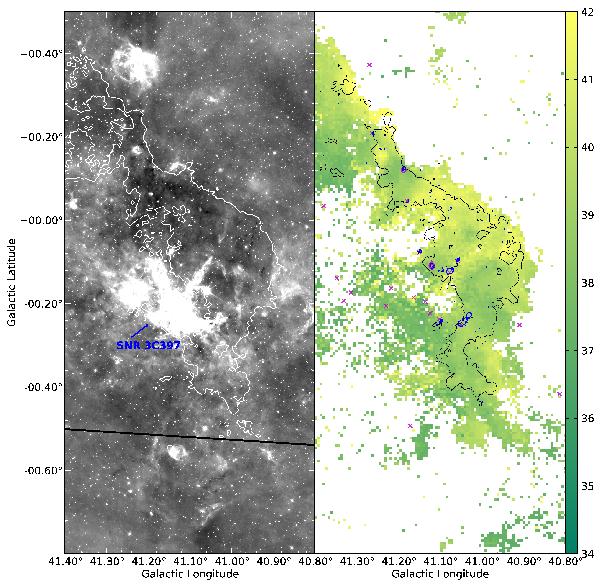
Left: grayscale of the 8 μm GLIMPSE image of GMF 41.0-41.3. The white contour shows the 13CO integrated intensity of 1 K km s-1. The solid black line shows the location of the Galactic midplane at the distance of this filament. The solid black line is the location of the Galactic plane at the distance of this filament. The supernova remnant 3C 397 is the (unrelated) bright IR emission region. Right: color scale of the centroid velocity field from the GRS 13CO data where the integrated intensity is above 1 K km s-1 in the indicated velocity range, shown in the color bar in km s-1. The blue contour is ATLASGAL 870 μm emission of 250 mJy beam-1. In magenta circles, we show all vlsr measurements of BGPS clumps that have velocities within the 13CO velocity range and with × those vlsr values outside of the 13CO velocity range. The diamonds are positions in the Wienen et al. (2012) catalog with a matching velocity. The black contours are the 13CO integrated intensity of 2 and 7 K km s-1.
Current usage metrics show cumulative count of Article Views (full-text article views including HTML views, PDF and ePub downloads, according to the available data) and Abstracts Views on Vision4Press platform.
Data correspond to usage on the plateform after 2015. The current usage metrics is available 48-96 hours after online publication and is updated daily on week days.
Initial download of the metrics may take a while.