Fig. A.4
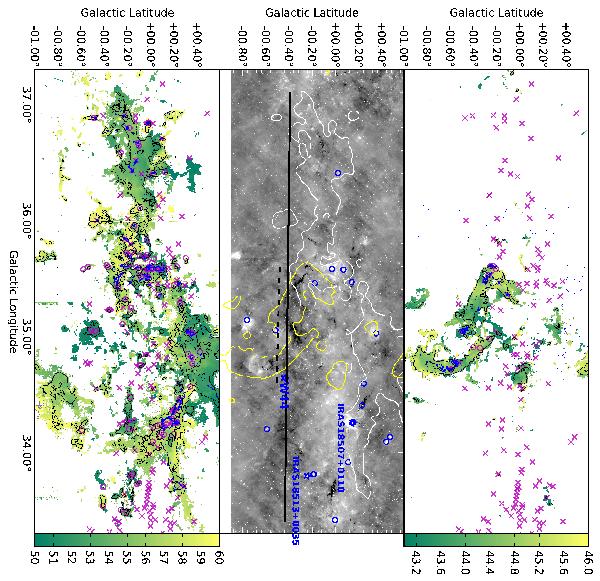
center: grayscale of the 8 μm GLIMPSE image of GMF 38.1-32.4. The white contour shows the 13CO integrated intensity of 0.5 K km s-1 between 50 and 60 km s-1 (left), and the yellow contour shows the 13CO integrated intensity of 0.5 K km s-1 between 43 and 46 km s-1 (right). Blue stars indicate the positions of IRAS sources and W 44, and blue circles are the positions of Hii regions from the CORNISH survey. The solid black line is the location of the Galactic plane at the distance of the 50−60 km s-1 filament, and the dashed black line corresponds to the plane at the distance of the 43−46 km s-1. Right and left: color scale of the centroid velocity field from the GRS 13CO data for the 43 to 46 km s-1 (right) and 50 to 60 km s-1 (left) filaments where the integrated intensity is above 1 K km s-1 in the indicated velocity range, shown in the color bar in km s-1. The blue contour is ATLASGAL 870 μm emission of 250 mJy beam-1 within each masked region. In magenta circles, we show all vlsr measurements of BGPS clumps that have velocities within the respective 13CO velocity ranges and with × those vlsr values outside of the 13CO velocity ranges. The diamonds are positions in the Wienen et al. (2012) catalog with a matching velocity. The black contours are the 13CO integrated intensity of 2 and 7 K km s-1.
Current usage metrics show cumulative count of Article Views (full-text article views including HTML views, PDF and ePub downloads, according to the available data) and Abstracts Views on Vision4Press platform.
Data correspond to usage on the plateform after 2015. The current usage metrics is available 48-96 hours after online publication and is updated daily on week days.
Initial download of the metrics may take a while.