Fig. A.3
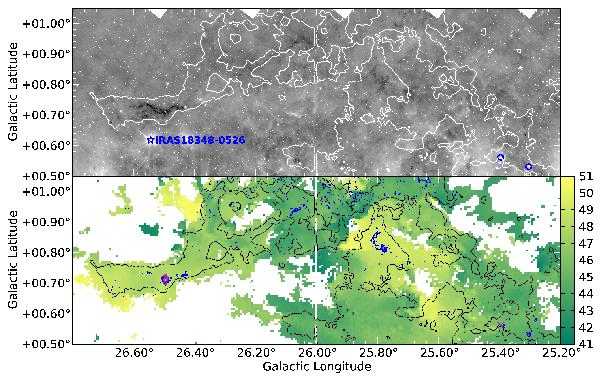
Top: grayscale of the 8 μm GLIMPSE image of GMF 26.7-25.4. The white contour shows the 13CO integrated intensity of 2 K km s-1. The blue star is the position of IRAS 18348-0526, and the blue circles are CORNISH detected Hii regions. Bottom: color scale of the centroid velocity field from the GRS 13CO data where the integrated intensity is above 1 K km s-1 in the indicated velocity range, shown in the color bar in km s-1. The blue contour is ATLASGAL 870 μm emission of 250 mJy beam-1. The magenta diamond indicates a pointing from the Wienen et al. (2012) NH3 catalog that has a consistent velocity, though the other two pointings (×, in the bottom right corner) have velocities outside of the 13CO range. The black contour is the 13CO integrated intensity at 2 K km s-1.
Current usage metrics show cumulative count of Article Views (full-text article views including HTML views, PDF and ePub downloads, according to the available data) and Abstracts Views on Vision4Press platform.
Data correspond to usage on the plateform after 2015. The current usage metrics is available 48-96 hours after online publication and is updated daily on week days.
Initial download of the metrics may take a while.