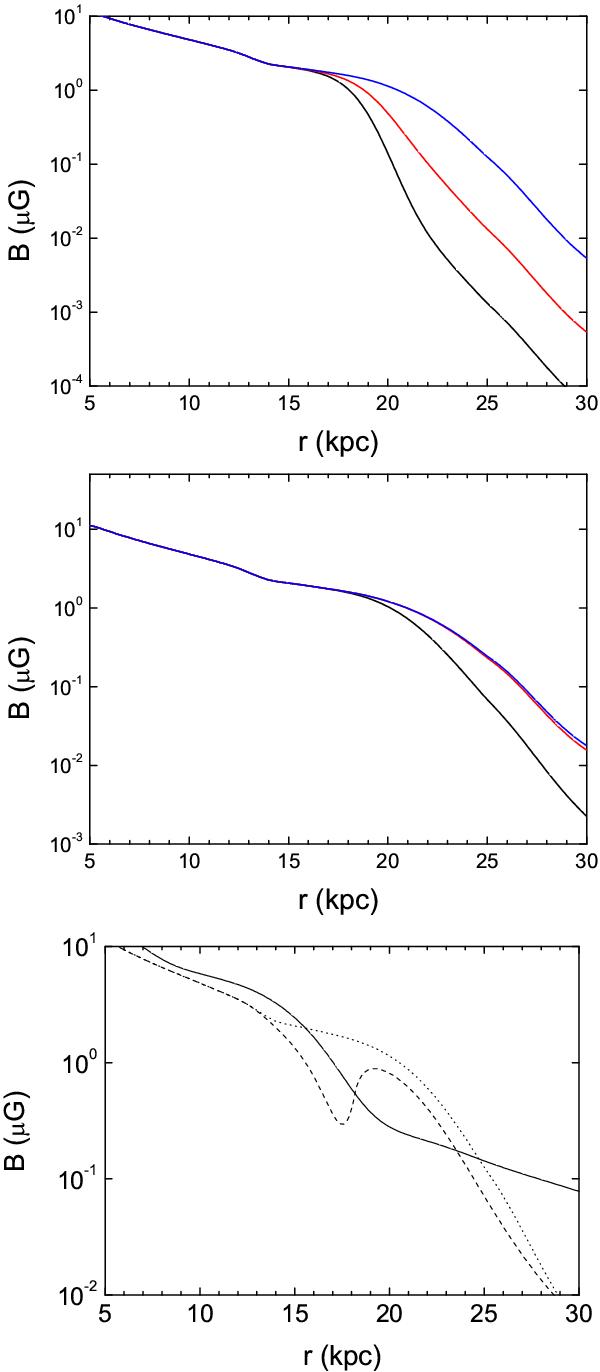
Fig. 3

Large-scale magnetic field strengths for different models of the ionized gas component and initial conditions. The top panel shows the strength of the final magnetic fields (i.e. at 10 Gyr) for different amplitudes of the initial conditions: curves from bottom to top indicate B0 = 10-5 μG, B0 = 10-4 μG, and B0 = 10-3 μG. The middle panel shows the final field strengths for different distances of the peak of the initial field from the centre: curves from bottom to top show r0 = 6 kpc, r0 = 16 kpc, and r0 = 20 kpc. The bottom panel shows the final magnetic field strengths for different models of the dynamo scaleheight: the solid curve corresponds to model 1, the dashed curve to model 2a, the dotted curve to model 2b.
Current usage metrics show cumulative count of Article Views (full-text article views including HTML views, PDF and ePub downloads, according to the available data) and Abstracts Views on Vision4Press platform.
Data correspond to usage on the plateform after 2015. The current usage metrics is available 48-96 hours after online publication and is updated daily on week days.
Initial download of the metrics may take a while.


