Fig. 1
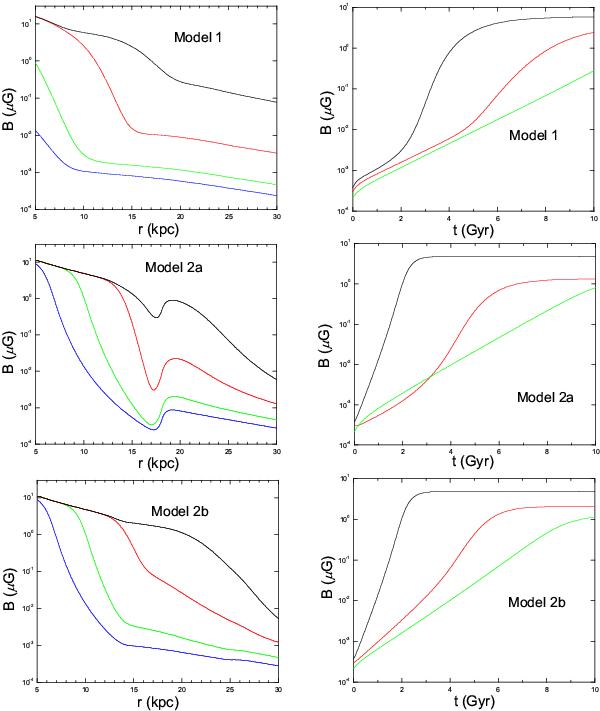
Left: radial profile of B for three different profiles of the dynamo scaleheight (see text). The curves from bottom to top in each panel indicate magnetic fields at times t = 1, 2, 5,and 10 Gyr. Right: growth of the large-scale magnetic field at r =10, 15, and 20 kpc (from top to bottom in each panel).
Current usage metrics show cumulative count of Article Views (full-text article views including HTML views, PDF and ePub downloads, according to the available data) and Abstracts Views on Vision4Press platform.
Data correspond to usage on the plateform after 2015. The current usage metrics is available 48-96 hours after online publication and is updated daily on week days.
Initial download of the metrics may take a while.