Fig. B.1
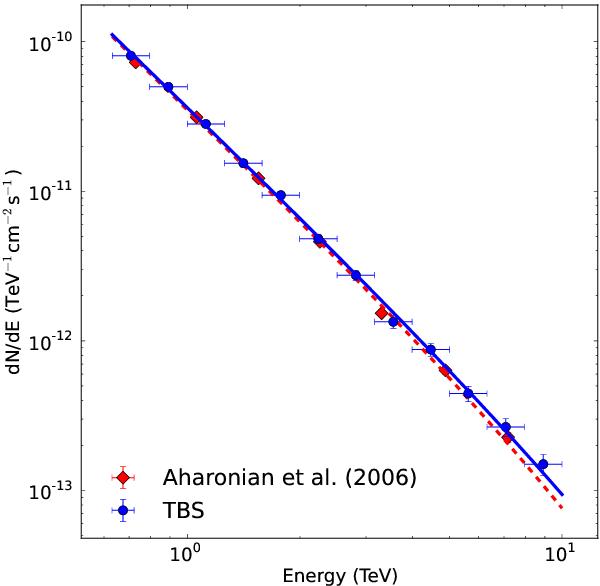
Differential energy spectra of the Crab nebula from Aharonian et al. (2006, red-dashed line with red-diamond markers) and from this work (TBS; blue-circle markers and blue line indicating the best-fit spectrum). The spectrum above 10 TeV could not be shown and therefore the spectra were truncated at this energy. See text in Sect. 4 and Appendix B for further information.
Current usage metrics show cumulative count of Article Views (full-text article views including HTML views, PDF and ePub downloads, according to the available data) and Abstracts Views on Vision4Press platform.
Data correspond to usage on the plateform after 2015. The current usage metrics is available 48-96 hours after online publication and is updated daily on week days.
Initial download of the metrics may take a while.