Fig. A.1
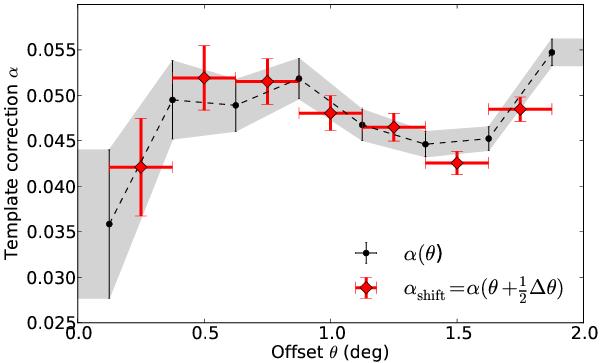
Example of interpolation of α(θ) for TBS based on H.E.S.S. data on Vela X (Abramowski et al. 2012). The α nodes calculated according to Eq. (6) are shown as black circles together with the corresponding 1σ envelope (grey-shaded area). The dashed black line illustrates the interpolation line along which a βi value will be obtained. The parameter Δθ is the bin width in θ. The shifted nodes αshift are drawn as red diamond markers. See text for further information.
Current usage metrics show cumulative count of Article Views (full-text article views including HTML views, PDF and ePub downloads, according to the available data) and Abstracts Views on Vision4Press platform.
Data correspond to usage on the plateform after 2015. The current usage metrics is available 48-96 hours after online publication and is updated daily on week days.
Initial download of the metrics may take a while.