Fig. 3
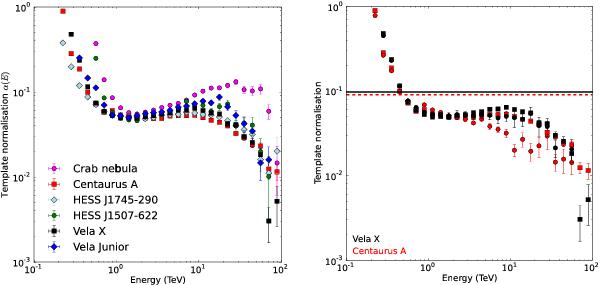
TBS and template correction. Left: θ and z-integrated template correction α(E) from data on the sources analysed in this work. Right: effective template correction βeff (circles) and α(E) (squares) for the sources Centaurus A (red) and Vela X (black). The black solid line represents the integrated value αstd of Vela X whereas the red dashed line represents the overall template correction from the Centaurus A data set. See text for further information.
Current usage metrics show cumulative count of Article Views (full-text article views including HTML views, PDF and ePub downloads, according to the available data) and Abstracts Views on Vision4Press platform.
Data correspond to usage on the plateform after 2015. The current usage metrics is available 48-96 hours after online publication and is updated daily on week days.
Initial download of the metrics may take a while.