Fig. 6
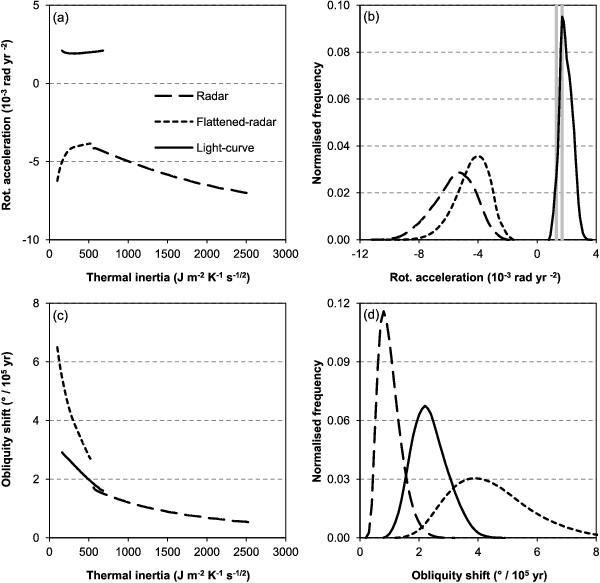
Summary of ATPM YORP effect modelling results for (1620) Geographos using its three different shape models (legend) and a fixed maximum equatorial diameter of 5.04 ± 0.07 km. a) Average YORP rotational acceleration as a function of thermal inertia. b) The distribution of possible YORP rotational acceleration values derived at the 3σ confidence level. The grey vertical lines represent the lower and upper bounds of the YORP rotational acceleration acting on (1620) Geographos as measured by Ďurech et al. (2008b). c) Average rate of YORP obliquity shift as a function of thermal inertia. d) The distribution of possible rates of YORP obliquity shift derived at the 3σ confidence level.
Current usage metrics show cumulative count of Article Views (full-text article views including HTML views, PDF and ePub downloads, according to the available data) and Abstracts Views on Vision4Press platform.
Data correspond to usage on the plateform after 2015. The current usage metrics is available 48-96 hours after online publication and is updated daily on week days.
Initial download of the metrics may take a while.