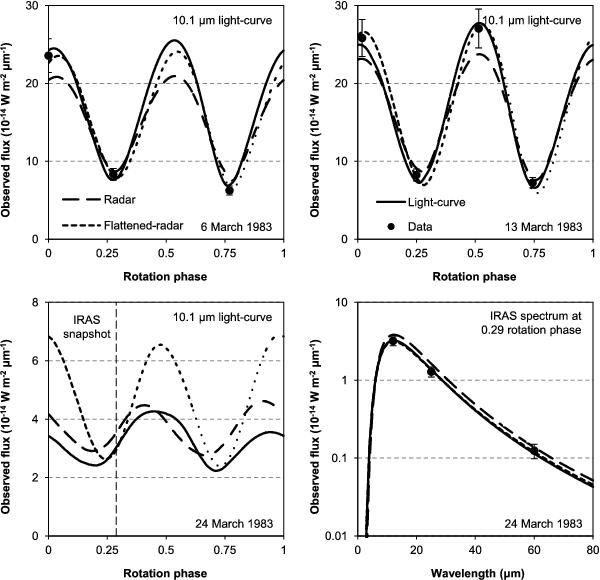
Fig. 2

Example ATPM fits to the (1620) Geographos thermal-infared observations (data points; Green 1985; Veeder et al. 1989; Tedesco et al. 2004) using the radar (dashed lines), flattened-radar (dotted lines), and light-curve (solid lines) shape models. The thermal-infrared spectrum of the flattened-radar shape model in the lower right panel is almost identical to that of the light-curve shape model.
Current usage metrics show cumulative count of Article Views (full-text article views including HTML views, PDF and ePub downloads, according to the available data) and Abstracts Views on Vision4Press platform.
Data correspond to usage on the plateform after 2015. The current usage metrics is available 48-96 hours after online publication and is updated daily on week days.
Initial download of the metrics may take a while.


