Fig. 8
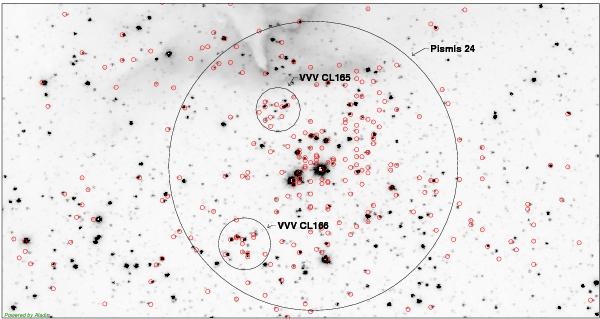
5′ × 3′ VVV KS image of Pismis 24 area (large circle). The probable subclusters VVV CL165 (top circle) and VVV CL166 (bottom circle) are indicated. The small red circles indicate YSOs (Fang et al. 2012). The shift between the stars in the VVV image and the YSOs from the catalog of Fang (2MASS data) is a consequence of the difference of angular resolution of each survey, 0.34′′ and 2.0′′ respectively. The radius of the black circle is given in Table 1.
Current usage metrics show cumulative count of Article Views (full-text article views including HTML views, PDF and ePub downloads, according to the available data) and Abstracts Views on Vision4Press platform.
Data correspond to usage on the plateform after 2015. The current usage metrics is available 48-96 hours after online publication and is updated daily on week days.
Initial download of the metrics may take a while.