Fig. 12
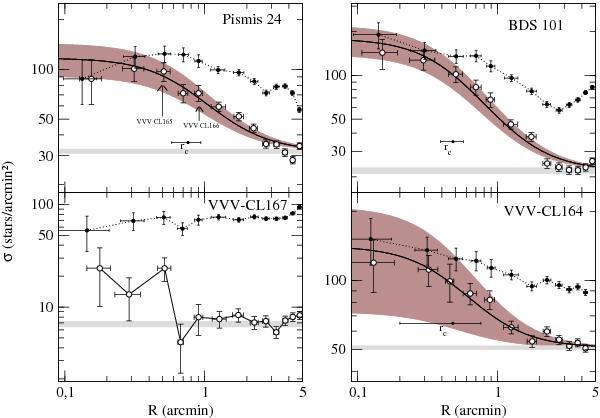
Colour–magnitude filtered RDPs (empty circles). The dots represent the raw cluster profile. The empty circles show the cleaned profiles. The best King-like fit is shown, when possible. The 1σ fit uncertainty is represented by the dark-shaded strip along the fit. The background level is the light-shaded region. The core radius (rc) is indicated.
Current usage metrics show cumulative count of Article Views (full-text article views including HTML views, PDF and ePub downloads, according to the available data) and Abstracts Views on Vision4Press platform.
Data correspond to usage on the plateform after 2015. The current usage metrics is available 48-96 hours after online publication and is updated daily on week days.
Initial download of the metrics may take a while.