Fig. 6
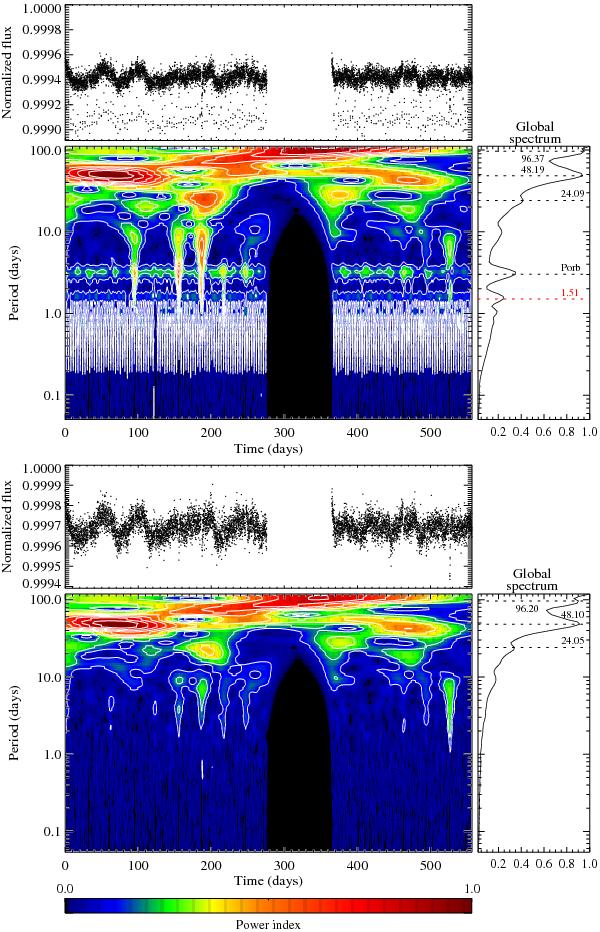
Top panel: light curve of Kepler-4 with transiting planet (at the top), its wavelet map (in the center) and global spectrum (to the right). Bottom panel: light curve of Kepler-4 with transits removed (at the top), its wavelet map (in the center) and global spectrum (to the right). Contour levels are 90%, 80%, 70%,..., 20% and 10% of the map maximum. The 6th-order Morlet wavelet was used.

Current usage metrics show cumulative count of Article Views (full-text article views including HTML views, PDF and ePub downloads, according to the available data) and Abstracts Views on Vision4Press platform.
Data correspond to usage on the plateform after 2015. The current usage metrics is available 48-96 hours after online publication and is updated daily on week days.
Initial download of the metrics may take a while.