Fig. 4
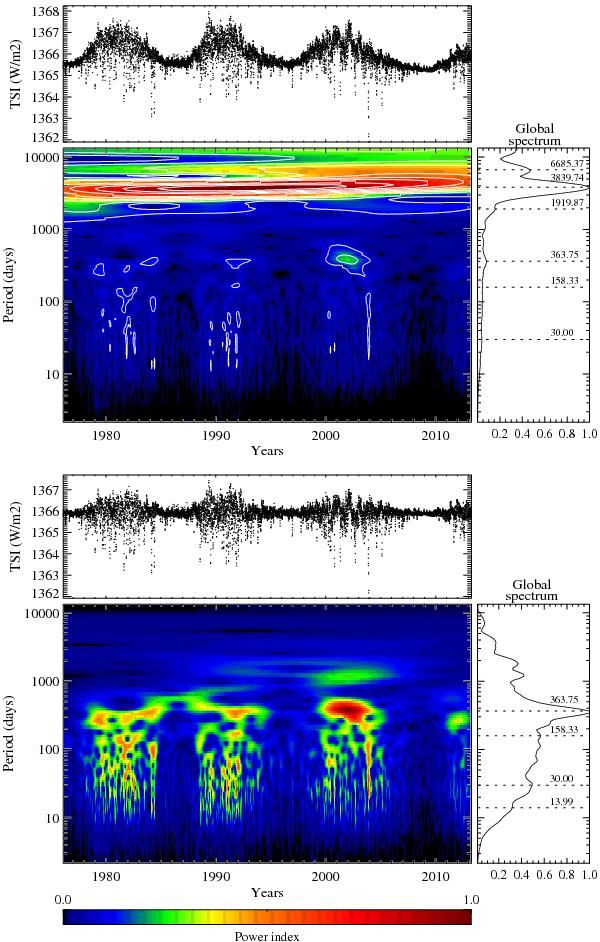
Top panel: composite TSI time series (at the top) and its wavelet local/global power spectra (in the center/to the right) considering long-term contributions. The most dominant feature of the spectrum is the 11 year cycle periodicity (P = 3840 days). Bottom panel: the long-term contributions are removed. The intermediate- and short-term periodicities are clearly identified: 364 days (annual solar feature related to magnetic fluxes generated deep inside the Sun), 158 days (Rieger-type period), 30 days (solar rotation period) and 14 days (harmonic of the rotation period and associated to solar active regions). Contour levels are 90%, 80%, 70%,..., 20% and 10% of the map maximum. The contour levels are not plotted in the bottom panel for better viewing of periods. The 6th-order Morlet wavelet was used.
Current usage metrics show cumulative count of Article Views (full-text article views including HTML views, PDF and ePub downloads, according to the available data) and Abstracts Views on Vision4Press platform.
Data correspond to usage on the plateform after 2015. The current usage metrics is available 48-96 hours after online publication and is updated daily on week days.
Initial download of the metrics may take a while.