Fig. 3
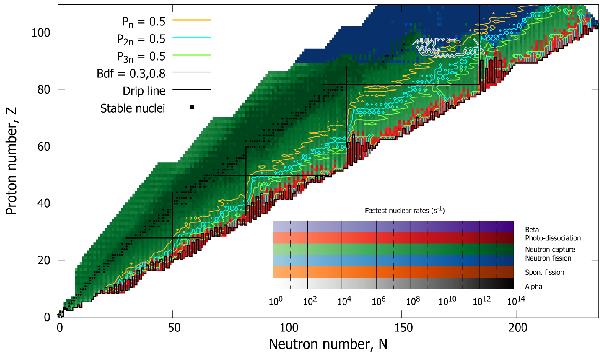
Fastest rate plotted given a temperature of 1 × 10⁹ K and a neutron density of 1 × 1030 cm-3. The contour lines indicate when the probability of β-delayed emission of n neutrons reaches 50%. The neutron drip line and the locations of the proton and neutron magic numbers are denoted with black solid lines. The location of the stable nuclei are denoted by the black squares. A color version of this figure is available in the online article.
Current usage metrics show cumulative count of Article Views (full-text article views including HTML views, PDF and ePub downloads, according to the available data) and Abstracts Views on Vision4Press platform.
Data correspond to usage on the plateform after 2015. The current usage metrics is available 48-96 hours after online publication and is updated daily on week days.
Initial download of the metrics may take a while.