Fig. 17
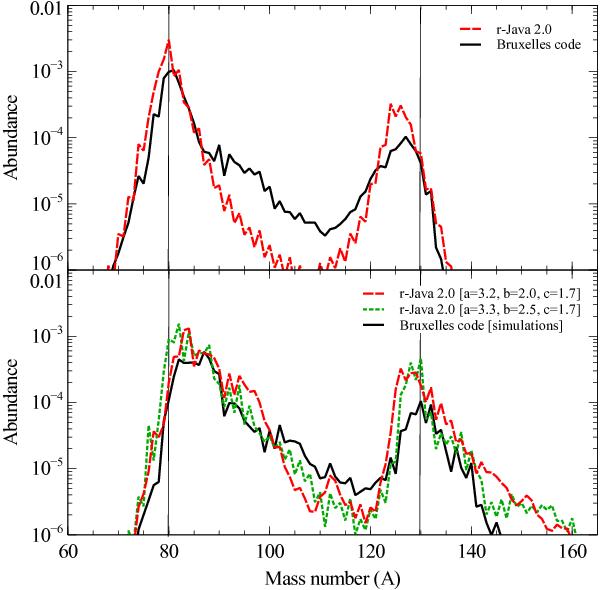
Top: initial abundances used for the comparison of r-process simulations from r-Java 2.0 and the Bruxelles nucleosynthesis code. The red dashed line denotes r-Java 2.0 and the black solid line the Bruxelles code. Bottom: final abundances from r-Java 2.0 considering two different density evolution profiles (red dashed line and green dotted line) compared to that of the Bruxelles code (black solid line). See text for details of simulations. The relevant magic numbers are highlighted with a fine vertical black line.
Current usage metrics show cumulative count of Article Views (full-text article views including HTML views, PDF and ePub downloads, according to the available data) and Abstracts Views on Vision4Press platform.
Data correspond to usage on the plateform after 2015. The current usage metrics is available 48-96 hours after online publication and is updated daily on week days.
Initial download of the metrics may take a while.