Fig. 16
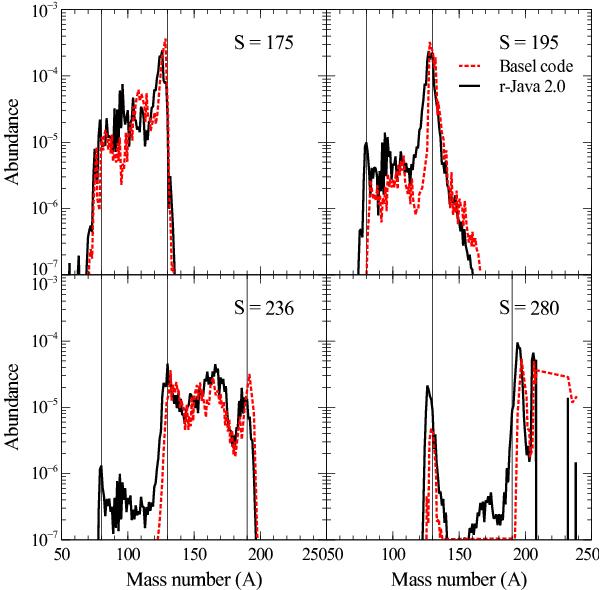
Comparison of r-process abundance yields as calculated by r-Java 2.0 (black solid line) and the Basel nucleosynthesis code (red dashed line). The relevant magic numbers are highlighted with a fine vertical black line. For each panel a different entropy was assumed, which changes the initial neutron-to-seed ratio as well as the evolution of the density, see text for details. Top-left: simulation run assuming the entropy of the wind is S = 175. Top-right: simulation run assuming the entropy of the wind is S = 195. Bottom-left: simulation run assuming the entropy of the wind is S = 236. Bottom-right: simulation run assuming the entropy of the wind is S = 280. See text for details of initial conditions.
Current usage metrics show cumulative count of Article Views (full-text article views including HTML views, PDF and ePub downloads, according to the available data) and Abstracts Views on Vision4Press platform.
Data correspond to usage on the plateform after 2015. The current usage metrics is available 48-96 hours after online publication and is updated daily on week days.
Initial download of the metrics may take a while.