Fig. 15
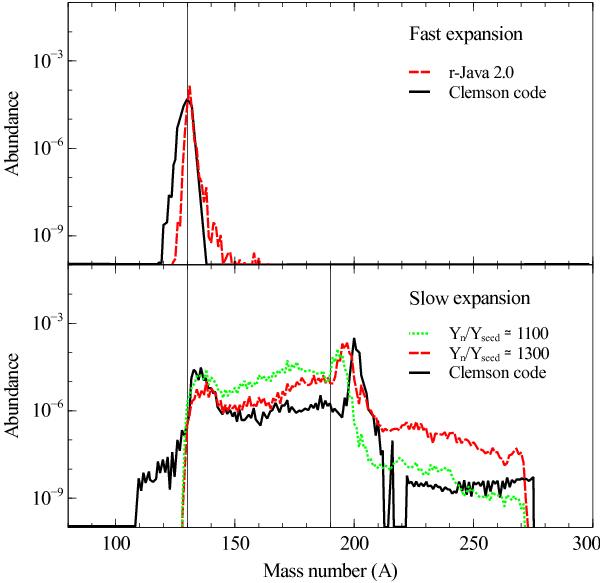
Top: comparison of the final abundances from r-Java 2.0 (red dashed line) and the Clemson nucleosynthesis code (black solid line) for a fast expansion r-process site. Bottom: a comparison of the final abundances from r-Java 2.0 with two different initial neutron-to-seed ratios (Yn/Yseed ~ 1100 denoted by the green dotted line, Yn/Yseed ~ 1300 by the red dashed line) and the Clemson nucleosynthesis code (black solid line) for a slow expansion r-process site. The relevant magic numbers are highlighted with a fine vertical black line.
Current usage metrics show cumulative count of Article Views (full-text article views including HTML views, PDF and ePub downloads, according to the available data) and Abstracts Views on Vision4Press platform.
Data correspond to usage on the plateform after 2015. The current usage metrics is available 48-96 hours after online publication and is updated daily on week days.
Initial download of the metrics may take a while.