Free Access
Fig. 12
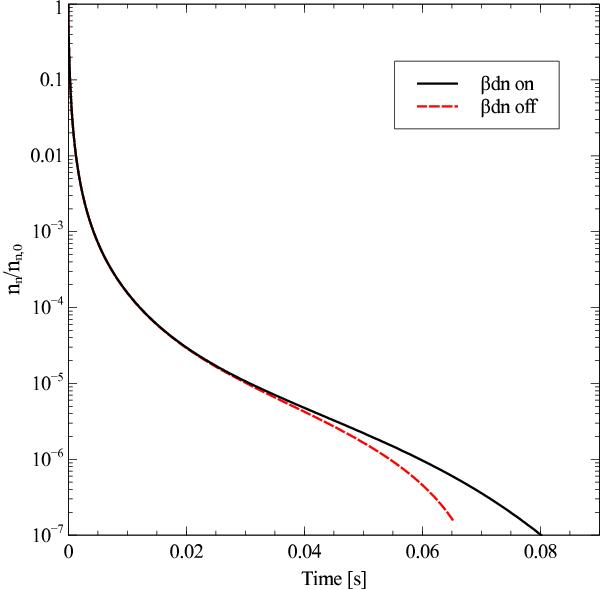
Evolution of neutron density until the r-process is terminated. The black line denotes an r-process simulation that included β-delayed neutron emission, and for the red dashed line that process was omitted.
Current usage metrics show cumulative count of Article Views (full-text article views including HTML views, PDF and ePub downloads, according to the available data) and Abstracts Views on Vision4Press platform.
Data correspond to usage on the plateform after 2015. The current usage metrics is available 48-96 hours after online publication and is updated daily on week days.
Initial download of the metrics may take a while.