Fig. 11
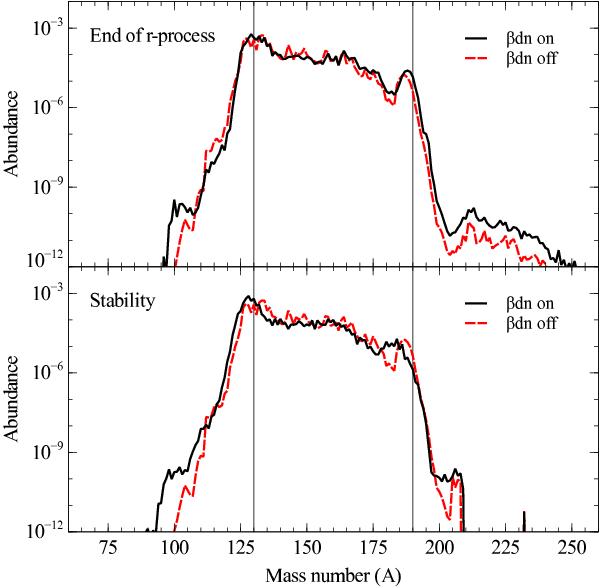
Effect of β-delayed neutron emission on nuclei abundance. The black line denoting an r-process simulation that included β-delayed neutron emission, and for the red dashed line that process was omitted. The results plotted in this figure, as well as in Figs. 12 and 13, are from simulation runs that were identical with the exception of whether or not β-delayed neutron emission was included. Top: the nuclei abundances at the moment the neutron-to-seed ratio drops below one. Bottom: the nuclei abundances after decay to stability. The relevant magic numbers are highlighted with a fine vertical black line.
Current usage metrics show cumulative count of Article Views (full-text article views including HTML views, PDF and ePub downloads, according to the available data) and Abstracts Views on Vision4Press platform.
Data correspond to usage on the plateform after 2015. The current usage metrics is available 48-96 hours after online publication and is updated daily on week days.
Initial download of the metrics may take a while.