Fig. 6

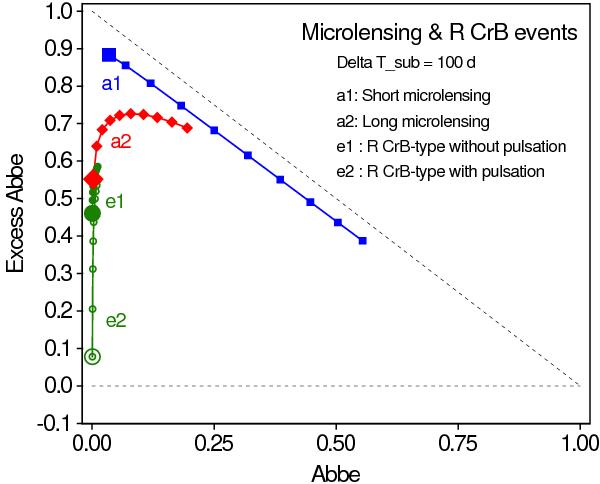
Locations in the  diagram of two simulated microlensing events (sequences a1 and a2) and two simulated RCrB events (sequences e1 and e2). (a1) Blue squares: OGLE source SC4-267762 with tE = 7.5 d. (a2) Red triangles: OGLE source SC33-553617 with tE = 153.5 d. (e1) Green filled circles: RCrB with four dip events. (e2) Green open circles: same as sequence e1, but with a two-frequency pulsation added to the light curves. See text for more details. The parameters of the time series are the same as in Fig. 5, except for the noise level which ranges from σnoise = 10 to 100 mmag by steps of 10 mmag (markers on each line, the bigger markers indicating the simulations with the smallest noise level of σnoise = 10 mmag). All excess Abbe values are computed with ΔTsub = 100 d. The horizontal dashed line is an guideline to
  and the diagonal dashed line an guideline to
  .
.
Current usage metrics show cumulative count of Article Views (full-text article views including HTML views, PDF and ePub downloads, according to the available data) and Abstracts Views on Vision4Press platform.
Data correspond to usage on the plateform after 2015. The current usage metrics is available 48-96 hours after online publication and is updated daily on week days.
Initial download of the metrics may take a while.


