Fig. F.1
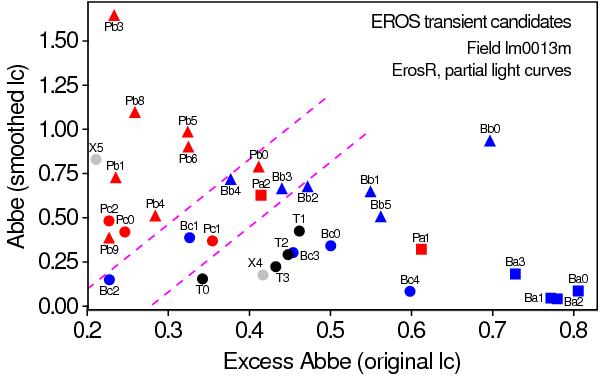
Abbe values of 100 d smoothed REROS light curves versus excess Abbe values of their original light curves. Only data for transient candidates are shown. Type B transient candidates are plotted in blue, using square, triangle and circle markers for Ba, Bb, and Bc types, respectively. Type T transient candidates are plotted in black circles. Type P transient candidates are plotted in red, using square, triangle, and circle markers for Pa, Pb, and Pc types, respectively. Other transient candidates are plotted in gray circles. The upper dashed line separates the upper-left part of the diagram, populated by type P transient candidates, while the lower dashed line separates the lower-right part of the diagram, where type B and T transient candidates are found (see text). The labels giving the transient IDs are the same as in Figs. 14 and 15.
Current usage metrics show cumulative count of Article Views (full-text article views including HTML views, PDF and ePub downloads, according to the available data) and Abstracts Views on Vision4Press platform.
Data correspond to usage on the plateform after 2015. The current usage metrics is available 48-96 hours after online publication and is updated daily on week days.
Initial download of the metrics may take a while.