Fig. 4
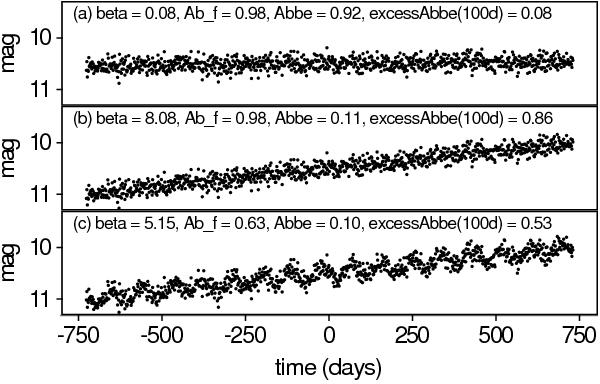
Simulated time series of light curves with a linear trend. The light curves are sampled with 1000 regularly spaced points over a total time interval ΔT = 4 years. a) Time series with a trend coefficient a = −0.1 mag/ΔT. b) Same as top panel, but with a = −1.0 mag/ΔT. c) Same as middle panel, but with a sine of period 90 days and amplitude 0.1 mag added to the time series. Noise is added in all the time series with a Gaussian-distributed amplitude of 0.1 mag. The β parameter of the trend (Eq. (4)), the Abbe value  of the detrended component of the time series, and the resulting values of
  and
and  (computed with ΔTsub = 100 d) are indicated at the top of each panel.
Current usage metrics show cumulative count of Article Views (full-text article views including HTML views, PDF and ePub downloads, according to the available data) and Abstracts Views on Vision4Press platform.
Data correspond to usage on the plateform after 2015. The current usage metrics is available 48-96 hours after online publication and is updated daily on week days.
Initial download of the metrics may take a while.