Fig. 3
Locations in the  diagram of light curves with trends, determined analytically from Eqs. (2), (3), and (5), using ΔT = 4 y, n = 1000, ΔTsub = 100 d, and various trend parameters β. Blue markers connected with a continuous blue line (upper line) locate light curves with no variability pattern in the detrended component (i.e.,
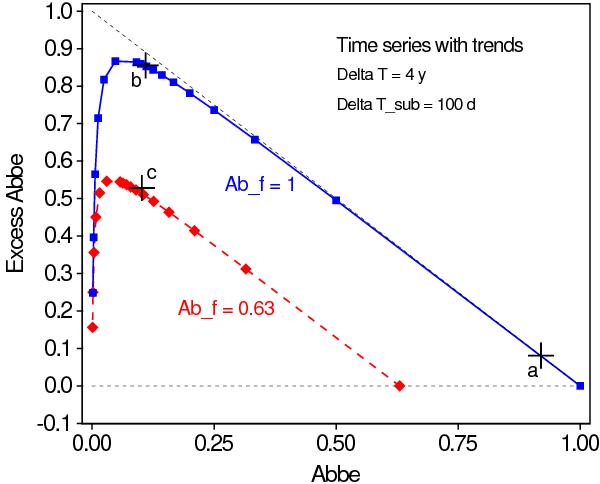
  ). Red markers connected with a dashed red line (lower line) assume the presence of a variability pattern in the detrended component with
  . The markers on each line locate time series with increasing trend parameter β of, from right to left, 0 to 10 by steps of 1, then from 10 to 640 by multiplication factors of 2. The black cross markers labeled a, b, and c locate the simulated time series shown in the top, middle, and bottom panels of Fig. 4, respectively. The horizontal dashed line is an guideline to
  and the diagonal dashed line an guideline to
  .
.
Current usage metrics show cumulative count of Article Views (full-text article views including HTML views, PDF and ePub downloads, according to the available data) and Abstracts Views on Vision4Press platform.
Data correspond to usage on the plateform after 2015. The current usage metrics is available 48-96 hours after online publication and is updated daily on week days.
Initial download of the metrics may take a while.