Free Access
Fig. B.1
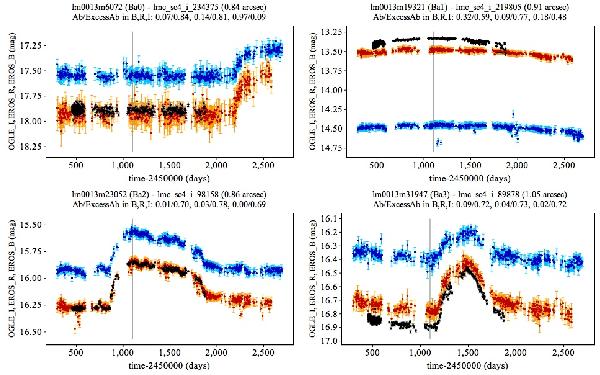
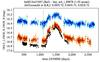
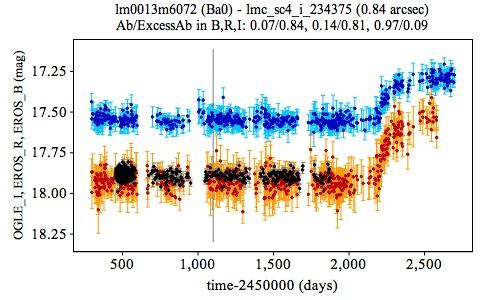
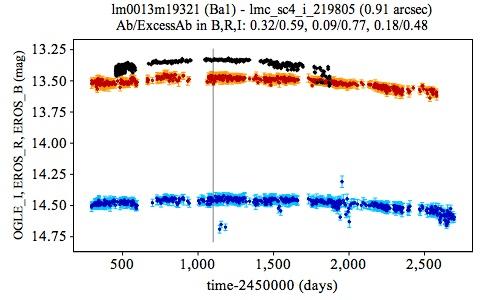
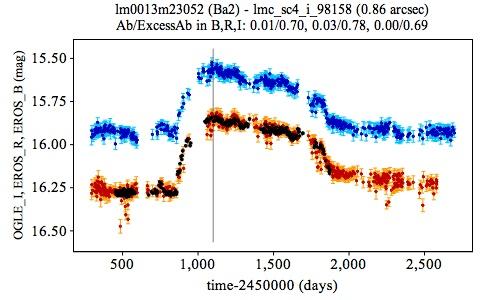
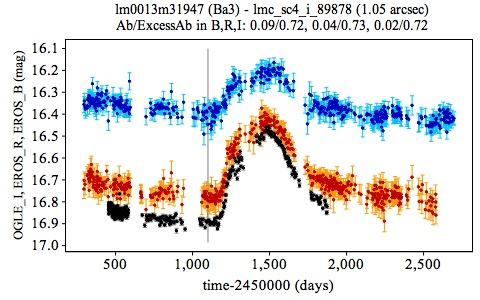
Light curves of EROS transient candidates with outbursts (type Ba) in blue/red for the BEROS/REROS photometric band. The light curve of the matching OGLE-II source is superposed in black. The vertical gray line locates the starting time (1100 d) of partial light curves considered in the paper.
This figure is made of several images, please see below:
Current usage metrics show cumulative count of Article Views (full-text article views including HTML views, PDF and ePub downloads, according to the available data) and Abstracts Views on Vision4Press platform.
Data correspond to usage on the plateform after 2015. The current usage metrics is available 48-96 hours after online publication and is updated daily on week days.
Initial download of the metrics may take a while.