Fig. 2
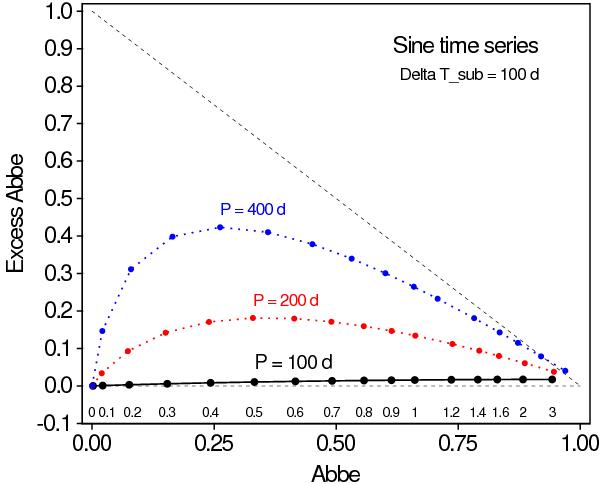
Locations in the  diagram of three sets of sixteen sinusoidal time series with different periods and noise levels. A value of ΔTsub = 100 d has been used in the calculation of
  for all time series. Black larger markers connected with a continuous line identify time series with a period of 100 d (i.e., equal to ΔTsub), while red and blue smaller markers connected with dotted lines identify times series with periods of 200 and 400 d, respectively, as indicated above the lines. Each marker on a line locates a time series with a specific noise level, increasing from σnoise/Asine = 0 to 3 from left to right, as indicated below the markers of the P = 100 d time series. The horizontal dashed line is an guideline to
  and the diagonal dashed line an guideline to
  .
.
Current usage metrics show cumulative count of Article Views (full-text article views including HTML views, PDF and ePub downloads, according to the available data) and Abstracts Views on Vision4Press platform.
Data correspond to usage on the plateform after 2015. The current usage metrics is available 48-96 hours after online publication and is updated daily on week days.
Initial download of the metrics may take a while.