Free Access
Fig. 19
 versus
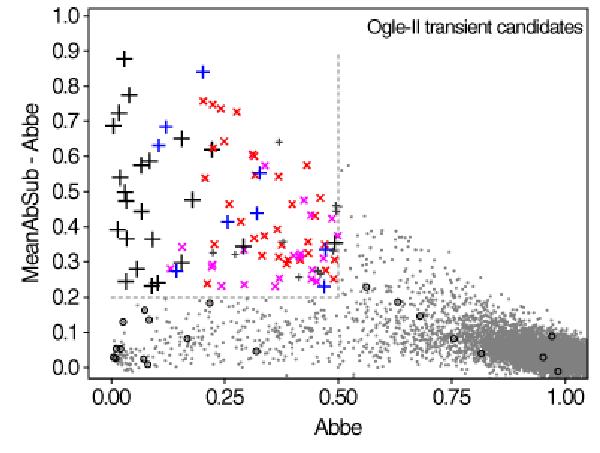
  diagram of OGLE-II transient candidates. Markers have the same meaning as in Fig. 18. The dashed lines delimit the region of transient candidates. OGLE-II sources falling out of this region are plotted in gray dots. Open circles identify non-transient OGLE-II sources that match EROS transient candidates.
Current usage metrics show cumulative count of Article Views (full-text article views including HTML views, PDF and ePub downloads, according to the available data) and Abstracts Views on Vision4Press platform.
Data correspond to usage on the plateform after 2015. The current usage metrics is available 48-96 hours after online publication and is updated daily on week days.
Initial download of the metrics may take a while.