Fig. 17
 versus
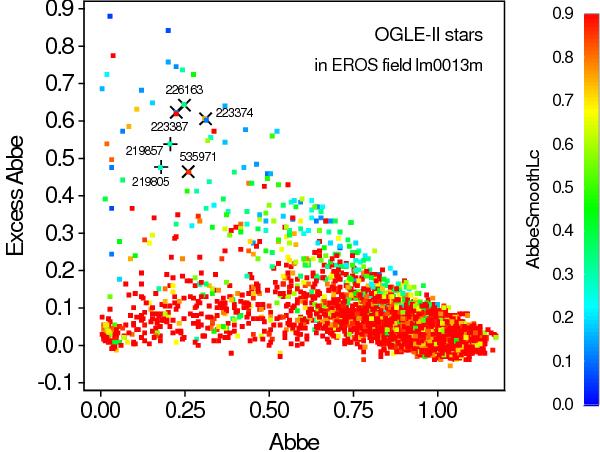
  diagram for the OGLE-II variable stars lying in the EROS field lm0013m. The color scale of each point is proportional to the Abbe value of the 100 d smoothed light curve as shown on the color scale on the right, with all Abbe values greater than 0.9 set to red. For illustration purposes, the locations of the components of an OGLE-II contaminating/contaminated pair (see text) are highlighted with ‘+’ markers, with the source IDs labeled next to the markers. Similarly, the locations of one of the groups of suspicious pulsating-like time series with trends, displayed in Fig. C.4 in Appendix C, are highlighted with “×” markers.
Current usage metrics show cumulative count of Article Views (full-text article views including HTML views, PDF and ePub downloads, according to the available data) and Abstracts Views on Vision4Press platform.
Data correspond to usage on the plateform after 2015. The current usage metrics is available 48-96 hours after online publication and is updated daily on week days.
Initial download of the metrics may take a while.