Fig. 14
 diagrams for each of the four categories of transient candidates (see text) that fall in the transient region
  and
and  (delimited by the long-dashed lines) from their REROS light curves. The short-dashed diagonal line locates the diagonal
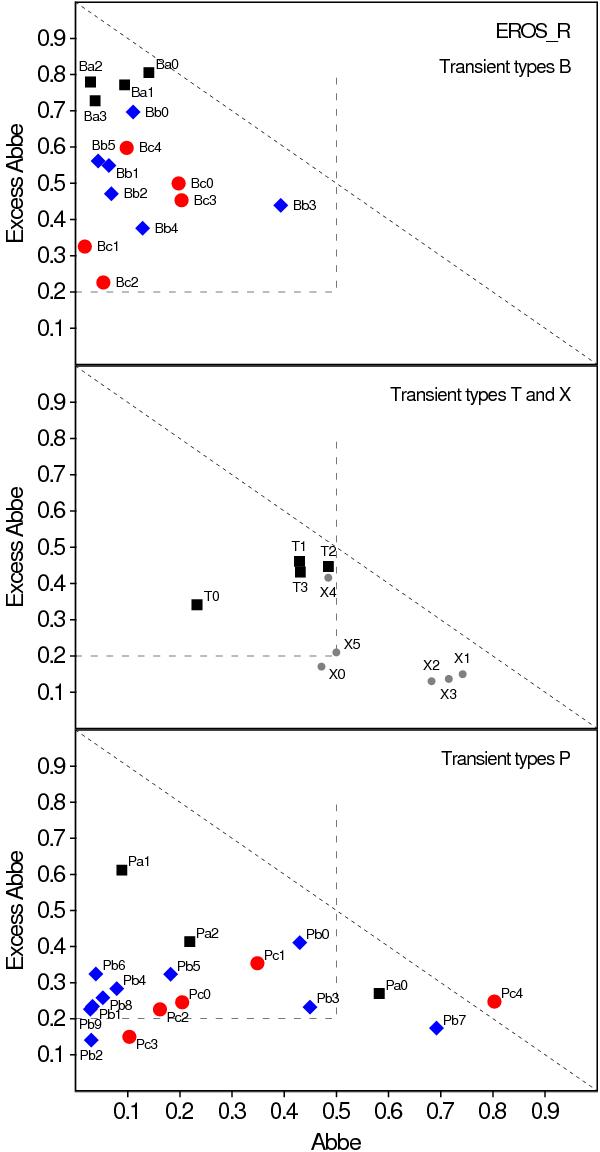
  . Top panel: transient candidates with bursts or outbursts (black squares for type Ba, blue diamonds for type Bb, and red circles for type Bc candidates). Second panel from top: transient candidates with trends (type T, black squares) and unclassified candidates (type X, gray dots). Bottom panel: transient candidates with pulsating-like features in their light curves (black squares for type Pa, blue diamonds for type Pb, and red circles for type Pc candidates). The correspondence between the labels in the figure and the EROS source ids is given in Table 1.
Current usage metrics show cumulative count of Article Views (full-text article views including HTML views, PDF and ePub downloads, according to the available data) and Abstracts Views on Vision4Press platform.
Data correspond to usage on the plateform after 2015. The current usage metrics is available 48-96 hours after online publication and is updated daily on week days.
Initial download of the metrics may take a while.