Fig. 10
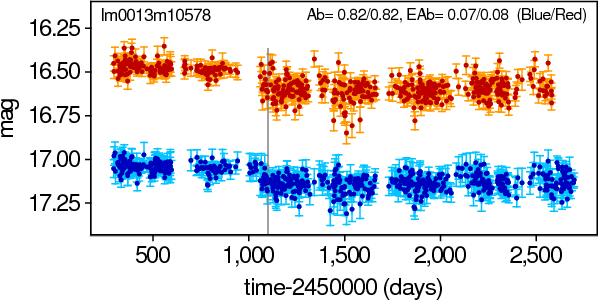
REROS (upper red curve) and BEROS (lower blue curve) light curves of star 10 578 highlighted in Figs. 9 and 11. Uncertainty bars are drawn in orange for REROS measurements and in cyan for BEROS. A vertical line is set at time 1100 d that defines the start of the partial light curves mentioned in Sect. 4.1.2. The values of  and
and  for the REROS and REROS partial light curves are given in the figure (Ab and EAb, respectively).
Current usage metrics show cumulative count of Article Views (full-text article views including HTML views, PDF and ePub downloads, according to the available data) and Abstracts Views on Vision4Press platform.
Data correspond to usage on the plateform after 2015. The current usage metrics is available 48-96 hours after online publication and is updated daily on week days.
Initial download of the metrics may take a while.