Fig. 7
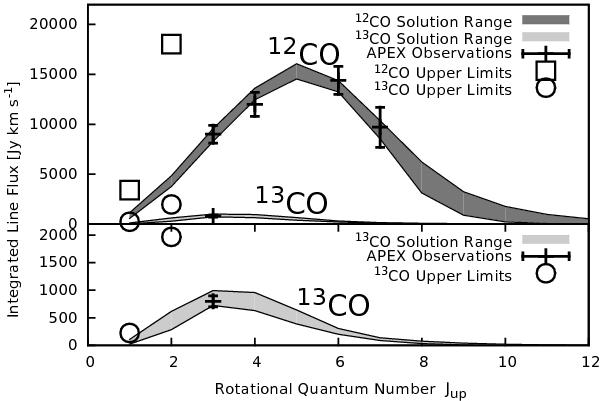
Top: integrated flux densities of 12CO and 13CO transitions in the central region (18′′ in diameter) of Circinus. We plot the solution range of 12CO (dark gray) and 13CO (light gray) derived from single-component LVG modeling of CO and 13CO lines with J ≥ 3. The range is selected from all solutions satisfying  < 1.5 (or Likelihood L> 0.6). We plot 12COJ = 2 → 1, 12COJ = 1 → 0, and their 13CO isotopic transitions for beam sizes >18′′ as upper limits (black boxes and circles) to our models. Bottom: integrated flux densities of 13CO, in a zoomed in view.
Current usage metrics show cumulative count of Article Views (full-text article views including HTML views, PDF and ePub downloads, according to the available data) and Abstracts Views on Vision4Press platform.
Data correspond to usage on the plateform after 2015. The current usage metrics is available 48-96 hours after online publication and is updated daily on week days.
Initial download of the metrics may take a while.