Fig. 6
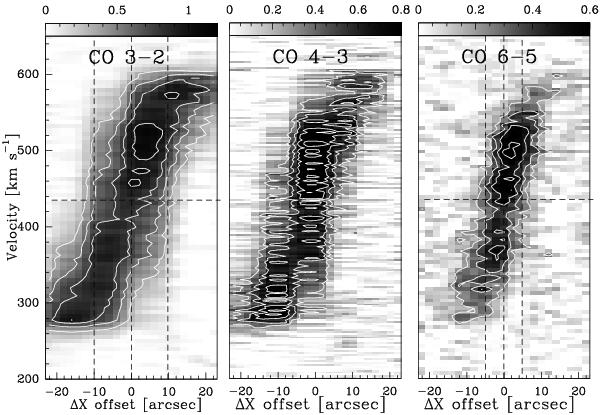
Position-velocity (P-V) maps of CO emission from the Circinus galaxy. From left to right: P-V diagrams of 12COJ = 3 → 2, 12COJ = 4 → 3, and 12COJ = 6 → 5. The slice is taken along the major axis obtained from 12COJ = 3 → 2 (position angle: 33.°5, see Table 4) and the direction is from northeast (bottom) to southwest (top). The contours are from 30% to 90% of the peak intensities with a spacing of 20%.
Current usage metrics show cumulative count of Article Views (full-text article views including HTML views, PDF and ePub downloads, according to the available data) and Abstracts Views on Vision4Press platform.
Data correspond to usage on the plateform after 2015. The current usage metrics is available 48-96 hours after online publication and is updated daily on week days.
Initial download of the metrics may take a while.