Free Access
Fig. 2
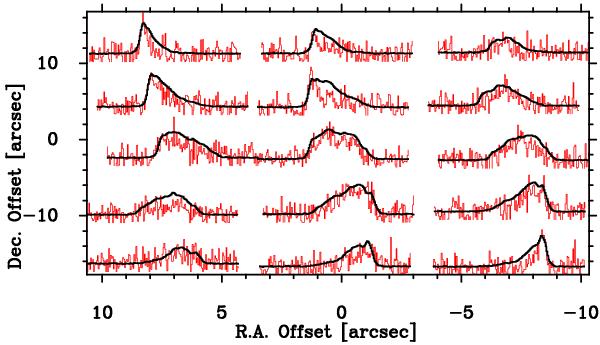
Ci 1→0 and 12COJ = 3 → 2 spectra from the central region of the Circinus galaxy. The Ci spectra are relatively noisier and are presented in red, while the 12COJ = 3 → 2 profiles are plotted in black. To reach similar intensities, Ci is scaled up by a factor of three.
Current usage metrics show cumulative count of Article Views (full-text article views including HTML views, PDF and ePub downloads, according to the available data) and Abstracts Views on Vision4Press platform.
Data correspond to usage on the plateform after 2015. The current usage metrics is available 48-96 hours after online publication and is updated daily on week days.
Initial download of the metrics may take a while.