Fig. C.3
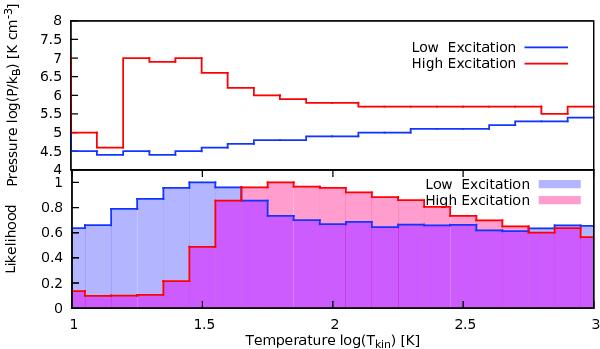
Upper panel: thermal pressure (log (nH2×Tkin)) of the best fitting results as functions of density, derived from the two-component LVG modeling. Lower panel: maximum likelihood as functions of temperatures for both excitation components. The low- and high-excitation components are plotted in blue and red shadows, respectively.
Current usage metrics show cumulative count of Article Views (full-text article views including HTML views, PDF and ePub downloads, according to the available data) and Abstracts Views on Vision4Press platform.
Data correspond to usage on the plateform after 2015. The current usage metrics is available 48-96 hours after online publication and is updated daily on week days.
Initial download of the metrics may take a while.