Fig. B.4
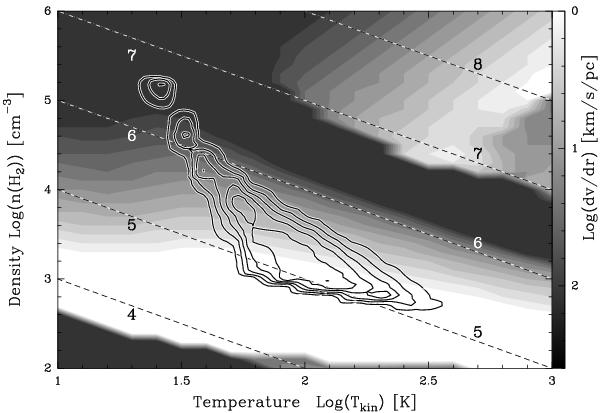
The contours show the distributions of the maximum likelihood for a given density and temperature in the single-component LVG fitting. Contours are drawn from 0.1 to 0.9 by 0.2. Background gray scale levels show the velocity gradient associated with the best LVG fitting results, for each given temperature and density. The dashed lines indicate the thermal pressure log (nH2×Tkin) in units of K cm-3.
Current usage metrics show cumulative count of Article Views (full-text article views including HTML views, PDF and ePub downloads, according to the available data) and Abstracts Views on Vision4Press platform.
Data correspond to usage on the plateform after 2015. The current usage metrics is available 48-96 hours after online publication and is updated daily on week days.
Initial download of the metrics may take a while.