Fig. B.1
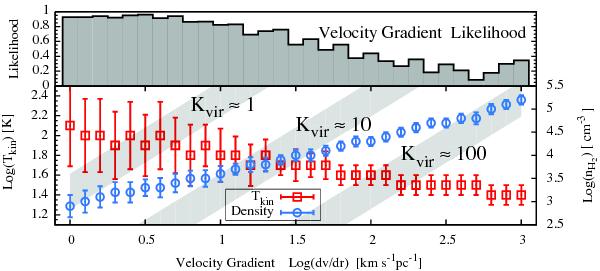
Upper panel: maximum likelihood as a function of the velocity gradient dν/dr for single-component LVG fitting. Lower panel: best-fit values of density (blue circles) and temperature (red squares) for a given velocity gradient as functions of velocity gradient, with error bars showing a 1σ range of the likelihood distribution. The gray regions have Kvir~ 1, 10, and 100.
Current usage metrics show cumulative count of Article Views (full-text article views including HTML views, PDF and ePub downloads, according to the available data) and Abstracts Views on Vision4Press platform.
Data correspond to usage on the plateform after 2015. The current usage metrics is available 48-96 hours after online publication and is updated daily on week days.
Initial download of the metrics may take a while.